Results
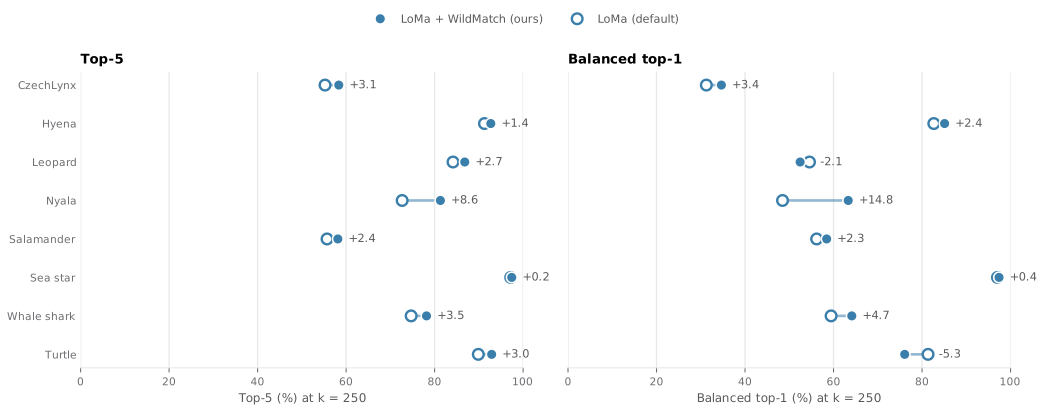
All matching methods score the same MegaDescriptor-L candidate list. Unless stated otherwise, numbers are at the default candidate budget \(k = 250\), in percent, with top-5 accuracy as the primary metric and balanced top-1 accuracy (top-1 averaged over individuals) as the second.
Provenance
Every number and figure on this page comes from the paper's results snapshot
(the results/ directory of the manuscript repository), exported by
paper/page/export_project_page_data.py into docs/data/. The manifest there records
the source file hashes and the manuscript commit. Static figures are generated by
the same script, the interactive views read the same JSON, and the tables typed on
this page are checked against it by the repository's test suite.
Main results
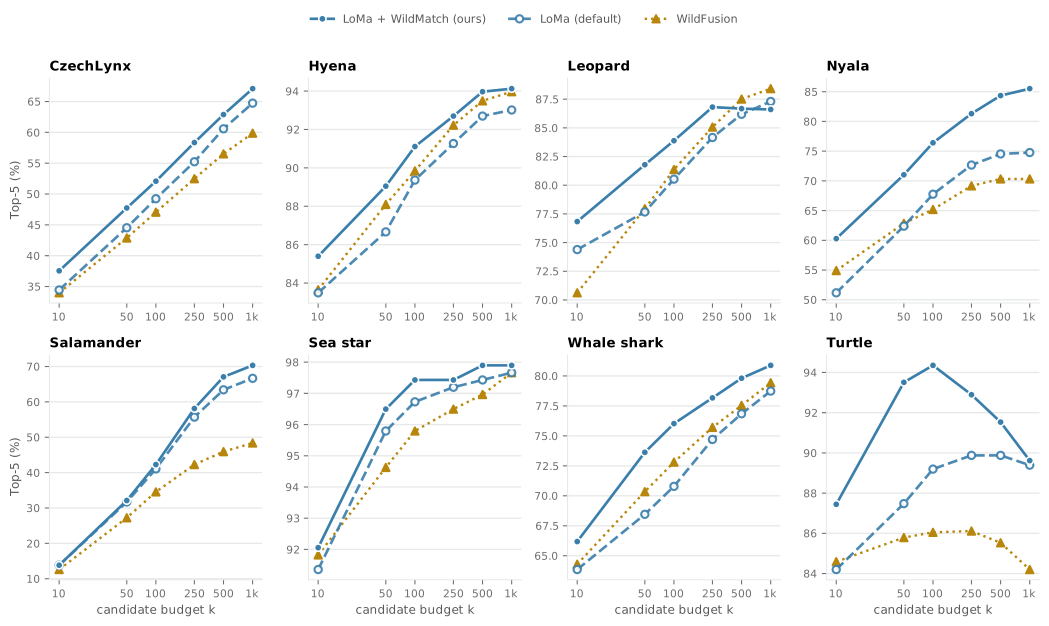
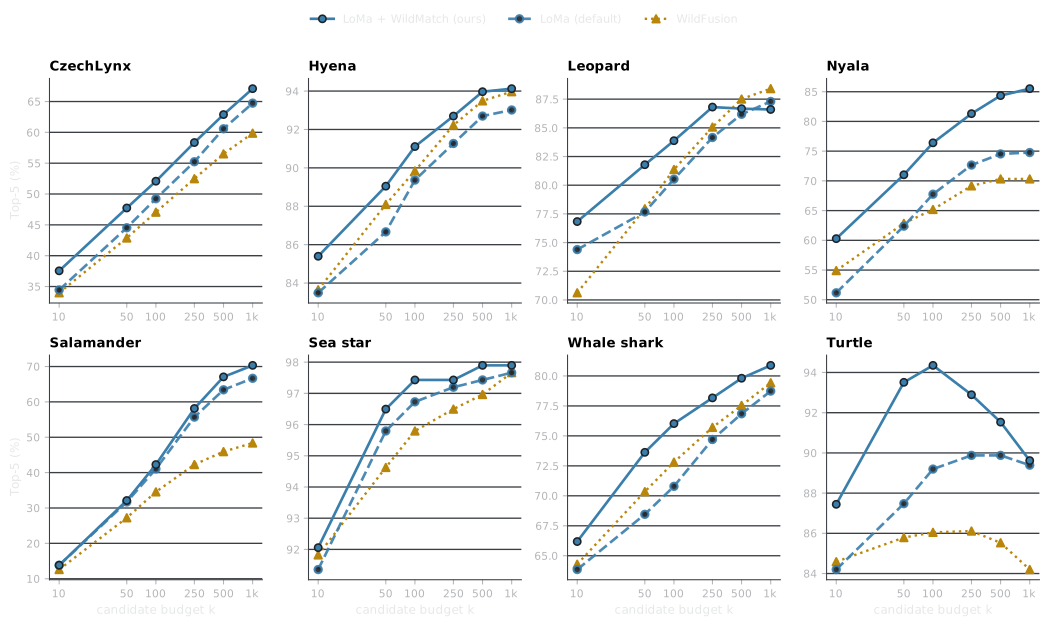
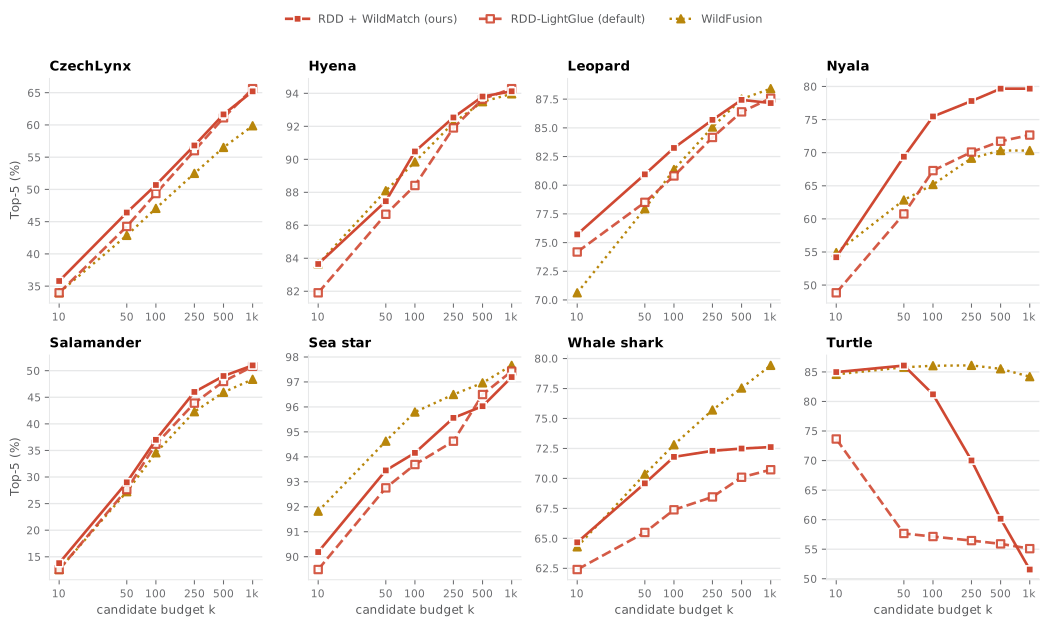
Fine-tuned LoMa improves over the default matcher and over WildFusion at almost every budget on all eight datasets. The smallest gain at \(k = 250\) is on Sea star, where the default matcher already exceeds 95 % top-5. The default matcher needs a candidate list two to five times longer to reach the fine-tuned accuracy. MegaDescriptor-L is the stronger candidate source on most datasets; DINOv3-L is better on CzechLynx and Sea star.
Explore the curves
Choose a dataset and a metric; toggle methods and the budget-independent baselines. Every plotted value is also listed in the table view below the chart.
All numbers
Filter by dataset, candidate budget and method group, sort any column, and download the filtered rows as CSV. Rows for the fine-tuned matchers are tinted blue.
Generalization to unseen identities
Under the unseen-identity protocol, both fine-tuned matchers beat their defaults and WildFusion at every budget and in both metrics, including the exhaustive budget \(k = 160\). Cosine retrieval scores the whole gallery and does not depend on \(k\). Cells give top-5 / balanced top-1.
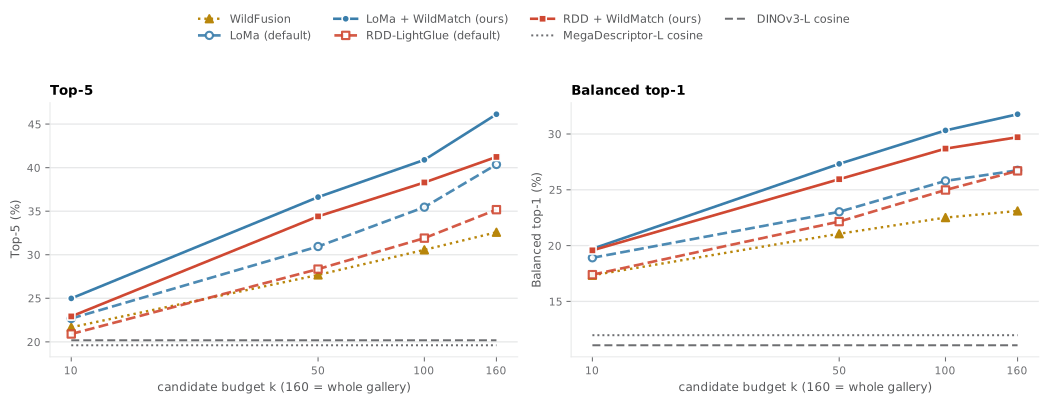
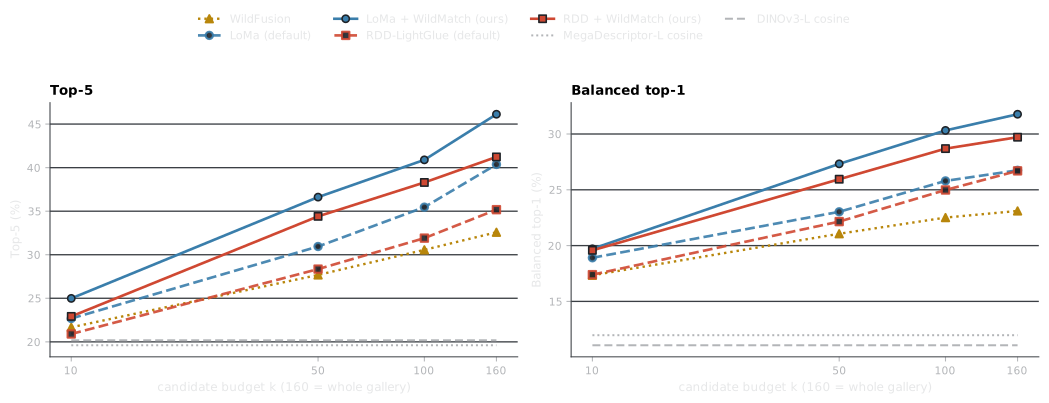
| Method | k = 10 | k = 50 | k = 100 | k = 160 |
|---|---|---|---|---|
| MegaDescriptor-L cosine | 19.6 / 12.0 | 19.6 / 12.0 | 19.6 / 12.0 | 19.6 / 12.0 |
| DINOv3-L cosine | 20.2 / 11.1 | 20.2 / 11.1 | 20.2 / 11.1 | 20.2 / 11.1 |
| WildFusion | 21.7 / 17.3 | 27.7 / 21.1 | 30.6 / 22.5 | 32.6 / 23.1 |
| LoMa default | 22.7 / 18.9 | 30.9 / 23.0 | 35.5 / 25.8 | 40.4 / 26.7 |
| LoMa + WildMatch | 25.0 / 19.7 | 36.6 / 27.3 | 40.9 / 30.3 | 46.1 / 31.8 |
| RDD-LightGlue default | 20.9 / 17.4 | 28.4 / 22.2 | 31.9 / 25.0 | 35.2 / 26.7 |
| RDD + WildMatch | 22.9 / 19.6 | 34.4 / 25.9 | 38.3 / 28.7 | 41.2 / 29.7 |
Applicability beyond LoMa
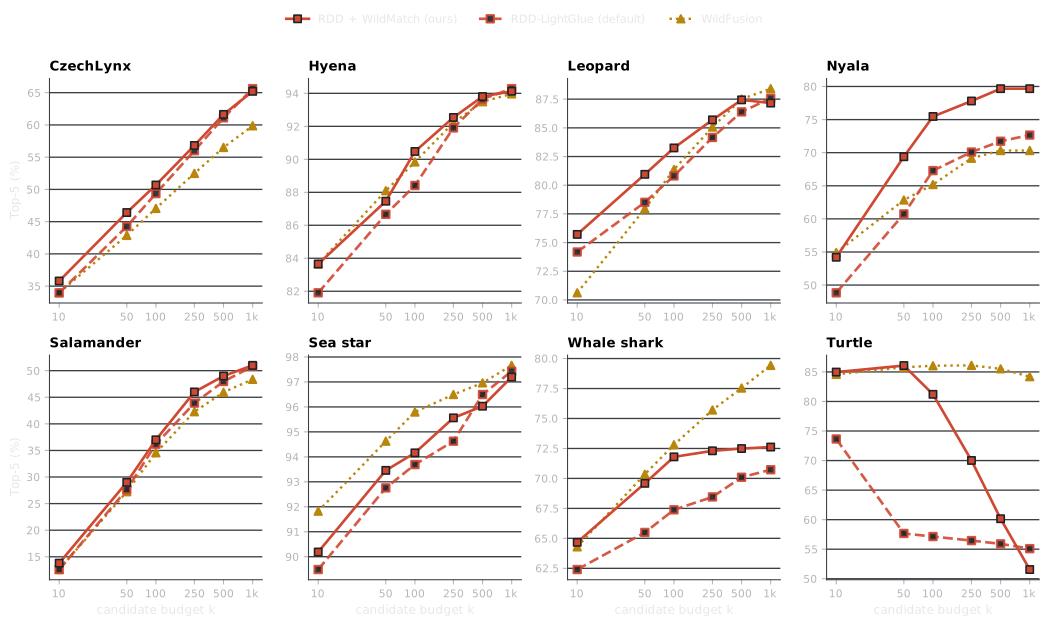
RDD-LightGlue fine-tuned with the same procedure improves over its default at most budgets; the paper reports Nyala, Salamander and CzechLynx, where the advantage is largest on Nyala and narrows at the largest budgets. The paper attributes the narrowing to the training pairs: negatives are mined from the top-ranked candidates, so the adapted matcher is less well calibrated for the easier but more numerous candidates that a long list adds. The figure below shows all eight datasets from the same results snapshot.
What to adapt in the matcher
For each matcher, the descriptor branch, the matching module, or both are fine-tuned with the same identity supervision and training data (CzechLynx, closed split, \(k = 250\)). Adapting the matching module gives most of the gain at a small fraction of the training cost; adapting the descriptor alone lowers balanced top-1 for LoMa and degrades RDD on both metrics.
| Matcher | Fine-tuned part | Top-5 | Bal. | Δ Bal. | GPU-h |
|---|---|---|---|---|---|
| LoMa | none (default) | 55.2 | 31.3 | – | – |
| LoMa | descriptor | 56.1 | 28.6 | −2.6 | 77 |
| LoMa | matching module (ours) | 58.3 | 34.7 | +3.4 | 5.1 |
| LoMa | both | 59.9 | 34.9 | +3.6 | 84 |
| RDD-LightGlue | none (default) | 56.0 | 33.4 | – | – |
| RDD-LightGlue | descriptor | 49.8 | 25.7 | −7.7 | 89 |
| RDD-LightGlue | matching module (ours) | 56.8 | 34.4 | +0.9 | 5.0 |
| RDD-LightGlue | both | 59.0 | 35.7 | +2.2 | 103 |
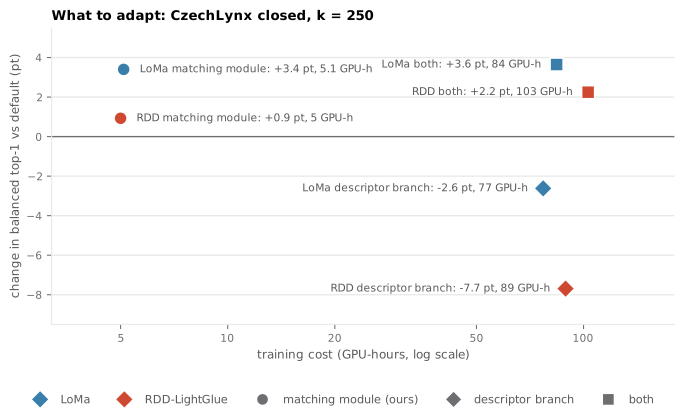
Identity labels say which images should match, which is what the matching module scores, while the descriptors were trained for geometric repeatability and may lose it under an identity objective. Training both parts adds +0.2 (LoMa) and +1.3 (RDD) balanced top-1 over the matching module alone, at 16 to 21 times the training cost, because a trainable descriptor rules out caching the features. GPU-hours count pure training steps on RTX 4090 GPUs; descriptor and joint values for runs stopped at the cluster's 24-hour limit are projected to the full 300-epoch schedule.
Matcher adaptation or identity classification
The same identity labels could instead be spent on the global model. After 10 GPU-hours of full fine-tuning, the class-weighted MegaDescriptor-L classifier only reaches the top-5 accuracy of the unadapted matcher and stays below 20 % balanced top-1, whereas the matcher starts at 31 % before adaptation and reaches 35 % after 5 GPU-hours. Across all eight datasets at \(k = 250\), the adapted matcher beats the fully fine-tuned classifier in balanced top-1 on every dataset and in top-5 on seven (Sea star goes to the classifier). See Training cost for the curves.
Why it works
Three views of the same k=250 runs explain the gains above: how far the scores of same- and different-individual pairs move apart, whether rare individuals share in the gain, and what the candidate budget costs.
Score separation
The gains above come from one mechanism: the fine-tuned matcher pushes the scores of same-individual pairs away from the scores of different-individual pairs. WildMatch is trained with a triplet margin objective, so that separation is what the training asks for; this view shows it on the test split of every dataset. For each query, the matcher scores its 250 MegaDescriptor-L candidates; every candidate is either the same individual as the query or a different one. The histograms count those pairs by image score, blue for same individual and red for different, with the default matcher on the left and LoMa + WildMatch on the right. Both matchers score the identical pairs.
- Pair scores are the matcher's image scores on the background-removed inputs. The different-individual pairs are the shortlist candidates MegaDescriptor-L already found similar, so they are hard negatives, not random pairs.
- Per-query margin switches to the quantity the objective acts on: each query's best same-individual score minus its best different-individual score. Queries right of zero rank their own individual above every other candidate; the view is defined for queries whose shortlist contains at least one photo of their individual.
- AUROC is the probability that a random same-individual pair outscores a random different-individual pair; overlap is the shared area of the two normalised histograms, 1 for identical distributions.
- Share and log axes: the different-individual pairs outnumber the same-individual pairs by far, so counts hide the blue histogram; the share view normalises each to unit mass and the log axis shows the tails.
Separation improves on all eight datasets by AUROC and overlap. The share of queries with a positive margin, which is close to Top-1 among queries whose individual is in the shortlist, rises on six and falls slightly on Leopard and Turtle; the paper reports the same two exceptions for balanced Top-1 at this budget.
Scores are read from the paper's own k=250 runs, and the Top-1 recomputed from them matches each run's recorded value exactly, which also verifies the identity labels.
Rare and common individuals
Most individuals in these datasets have a handful of gallery images and a few have hundreds. A method that only improves the well-photographed animals would leave the monitoring problem where it is. This view bins the test queries by how many gallery images their individual has and shows Top-1 or Top-5 for the default matcher and for LoMa + WildMatch in each bin, with the shortlist ceiling and a bootstrap interval on the gain.
- Bins are fixed and shared by every dataset: 1, 2–4, 5–9, 10–29 and 30 or more gallery images. Queries whose individual has no gallery image cannot be retrieved by any method and are excluded; their number is given in the caption.
- Ceiling: the diamond is the share of the bin's queries whose individual is among the 250 candidates. Rare individuals reach the shortlist less often, so part of their lower accuracy is set before any matcher runs.
- Gain interval: a paired bootstrap over the bin's queries (2,000 resamples). An interval that excludes zero marks a gain the bin's size supports; bins with fewer than 20 queries are drawn faint and flagged in the table.
- Reading: in Top-5, the paper's primary metric, no populated bin on any dataset loses accuracy, and the largest gains often fall on the rarest individuals: queries whose individual has a single gallery image gain 9.8 points on Leopard, 14.3 on Nyala, 11.1 on Whale shark and 25.6 on Turtle. On CzechLynx the gain is a near-constant 2 to 3 points in every bin. Fine-tuning therefore does not trade rare individuals for common ones. In Top-1, the losses the paper reports for Leopard and Turtle sit in the middle bins (2 to 29 gallery images), while their singletons and their best-covered individuals hold or gain.
The cost of k
Every method ranks the k MegaDescriptor-L candidates of a query, so k sets both a ceiling and a bill. A query whose individual is not among the candidates cannot be retrieved by any matcher, and the matching time grows linearly with k because every query is matched against all k candidates. Move the slider over the six measured budgets; nothing is interpolated.
- Individual inside the shortlist is the share of queries with at least one image of their individual among the k candidates. Both matchers rank the same candidates, so it is their shared ceiling: Top-5 can never exceed it.
- Top-5 for the default matcher and for LoMa + WildMatch at that k, from the same runs as the tables above.
- Matching time is the Vismatch feature-matching timer over all query × candidate pairs, scaled to 1,000 queries. Feature extraction, candidate selection and model setup are excluded. The per-pair cost is nearly constant, about 1.8 ms on an RTX 4090 and 1.4 ms on an H100, so cost is proportional to k while the shortlist share saturates.
- Hardware comes from Slurm accounting and is shown next to every time. The Nyala and Whale shark runs and the Turtle default runs predate the launcher's task records, so their partition is not recorded; their per-pair pace matches the RTX 4090 runs.