Training cost
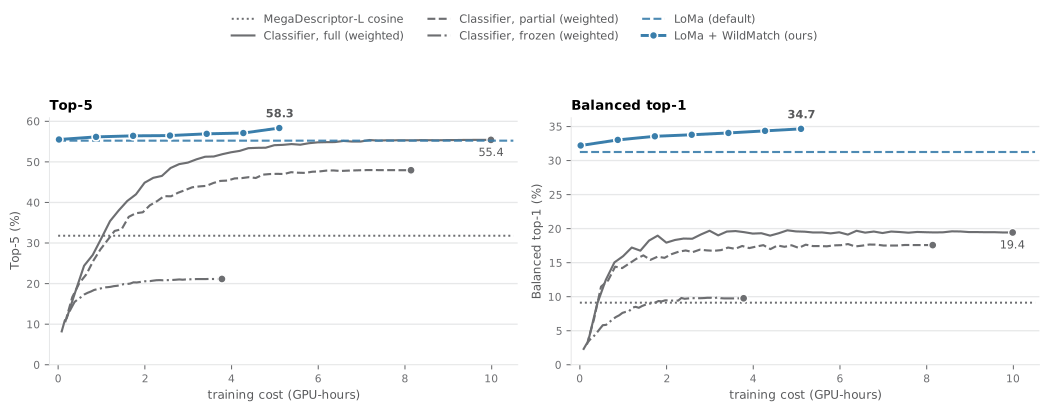
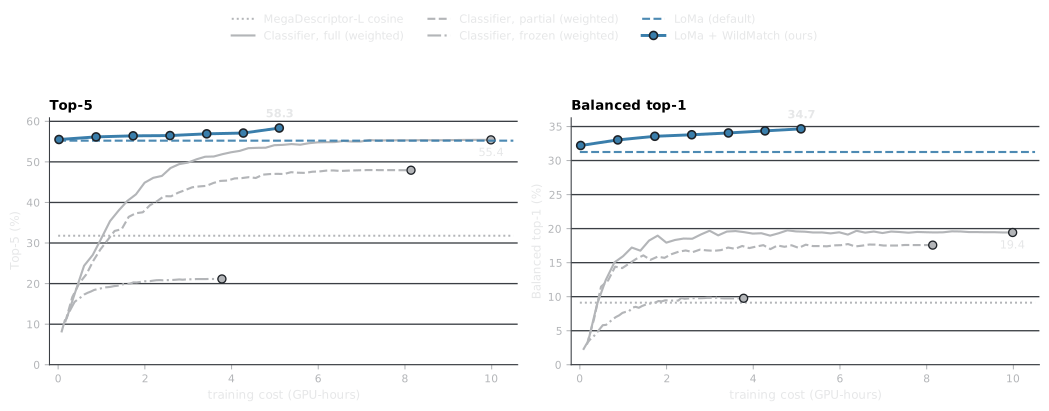
Matcher adaptation or identity classification, by training cost, on CzechLynx (closed split, \(k = 250\)). The curves show top-5 and balanced top-1 accuracy of fine-tuned LoMa checkpoints and of the class-weighted MegaDescriptor-L classifier with the backbone frozen, partially fine-tuned, or fully fine-tuned, as a function of cumulative training GPU-hours on RTX 4090 GPUs. The default LoMa matcher and cosine retrieval need no training and are drawn as flat lines.
Explore the curves
Hover for the epoch and cost behind each point; switch the metric or use a logarithmic cost axis to separate the first fine-tuning checkpoint (0.02 GPU-hours) from the rest.
Final points
| Method | Training GPU-h | Top-1 | Top-5 | Bal. top-1 |
|---|---|---|---|---|
| Cosine retrieval (MegaDescriptor-L) | 0 | 16.2 | 31.8 | 9.1 |
| LoMa default | 0 | 46.0 | 55.2 | 31.3 |
| LoMa + WildMatch | 5.1 | 49.1 | 58.3 | 34.7 |
| Classifier, frozen backbone (weighted) | 3.8 | 8.8 | 21.1 | 9.8 |
| Classifier, partially fine-tuned (weighted) | 8.1 | 24.0 | 47.9 | 17.6 |
| Classifier, fully fine-tuned (weighted) | 10.0 | 30.1 | 55.4 | 19.4 |
How the costs are counted
- Both arms were trained on the
rtx4090_batchpartition of the same cluster (Slurm accounting checked on 2026-10-02). - GPU-hours count pure training steps: for the matcher, the per-epoch training time of the 4-GPU job summed up to each saved checkpoint; for the classifiers, the training bars of each epoch. Per-epoch evaluation, setup and checkpointing are excluded. A conservative whole-job accounting (8.9 GPU-h for the matcher, 5.8 / 10.0 / 11.9 GPU-h for the frozen / partial / full classifiers) is available as an alternative view.
- The matcher's mining and feature-cache costs are excluded, and inference cost is not part of this figure. Matching time at test grows with \(k\).
- The matcher was trained on 80 % of the training images and the classifiers on 100 %; 300 versus 50 epochs; one seed each.
- The curves are evaluated on the test split because no clean validation split exists, so no checkpoint is ever selected from them. Each method's fixed final epoch is the reported result.
- The matcher curve combines intermediate checkpoints from a re-run of the training job with the final checkpoint of the original run; both use the same recipe.
Why the matcher adapts more cheaply
A classifier learns parameters for each individual, so its training is dominated by the frequently photographed ones, while the matcher is trained on image pairs and has no per-identity parameters. The classifier also cannot recognize individuals outside its label set: it must be retrained whenever a new individual is added and cannot be evaluated under the unseen-identity protocol.